Irish Language Map
- JavaScript
- Node
- Express
- EJS
- Leaflet
- Git
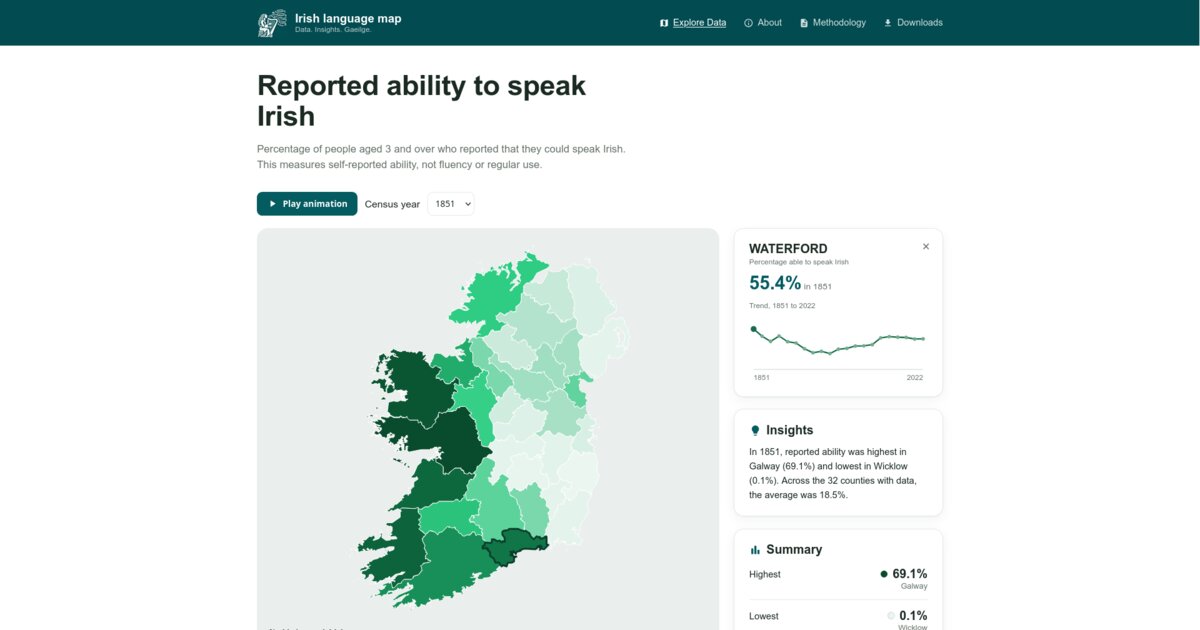
An interactive map of the percentage of people who reported being able to speak Irish in each county, across every census from 1851 to 2022.
Live at irishlanguagemap.org.
What it does
All 32 counties are shaded on one green scale, light for few speakers, dark for many. Press Play to run through the census years, or pick one from the dropdown. Click a county for its exact figure and a small chart of its trend over time.
Decisions, and what they cost
The map data is prepared once, not in the browser
The county outlines started as a 92 MB file from Ordnance Survey. You cannot send that to a phone.
So I cut it down before it ever ships, with a tool called mapshaper:
npx mapshaper public/data/ireland-counties.geojson \
  -each 'COUNTY=ENG_NAME_VALUE.trim().toUpperCase()' \
  -dissolve COUNTY \
  -simplify 5% keep-shapes \
  -filter-fields COUNTY \
  -o format=geojson precision=0.0001 \
  public/data/ireland-counties-simplified.geojson
Each flag does one job. -dissolve merges the dozens of little sub-polygons into
a single shape per county. -simplify 5% keep-shapes throws away all but a
twentieth of the points while keeping every county intact. -filter-fields and
precision=0.0001 drop every attribute and decimal place the map never uses. And
-each normalises the county name so it lines up with the keys in the statistics
data. The six Northern Ireland counties went through the same pipeline, then I
merged the two into one 32-county file.
What the browser downloads is a small file that draws instantly. The heavy work happens once on my machine, not once per visitor.
Built as plain pages, not an app
The whole site is pre-rendered to plain HTML and served from GitHub Pages. There is no server doing work when you visit, nothing to run, and nothing to pay for.
The map itself is still interactive once it loads, but the pages around it are just files. For a reference site that changes only when a new census lands, that is the right trade.
The parts that were actually hard
The North runs its own census
The map shows all 32 counties, but the six in Northern Ireland come from a separate census, on its own schedule, with its own gaps. Three problems came out of that, and each is handled openly rather than smoothed over.
A long gap in the record. Irish was recorded across the whole island from 1851 to 1911, then not again in the North until 1991. So the six counties are genuinely blank for most of the 20th century. The trend chart breaks its line across that gap instead of drawing a straight one, because a straight line there would invent data that was never collected.
Years that do not line up. The Northern censuses of 2001 and 2021 are shown under the Republic’s 2002 and 2022, since that is as close as they get. The county card says which census a figure actually came from, so the join is stated rather than hidden.
A city that sat in two counties. For three early years there is no full-county figure for Antrim or Down, because Belfast straddles both and was counted as one. Those six values are estimated by splitting Belfast between the two. Every other number on the map is as published, and the estimated ones are flagged as estimates.
Old counties are not today’s counties
The census did not always use the county lines we use now. Tipperary was returned as two ridings, cities were sometimes counted apart from their county. Left alone, the same place appears under different names in different years and nothing lines up.
So the historical pieces are added back up to present-day counties, giving one consistent value per county in every year. Without that step the map would have holes and double-counts that are not really in the data, just in how it was recorded.
What’s next
- The 2027 Northern Ireland results, when they land.
- A view by proportion change rather than absolute percentage.
- Small-area data below county level, where the census supports it.
- An Irish translation of the site, crowdsourced from people who speak it. Fitting, for a map about the language.
- Snap and share, so you can send anyone the exact map view you are looking at.